AI-assisted draft · reviewed, fact-checked, and published by Kevin Proffitt.
Cut Azure Monitor Costs 30-60%: Log Analytics Tuning
An Azure Monitor bill is mostly a per-GB ingestion meter. Table tiers, retention, sampling, and daily caps can cut it 30-60% without losing real signal.
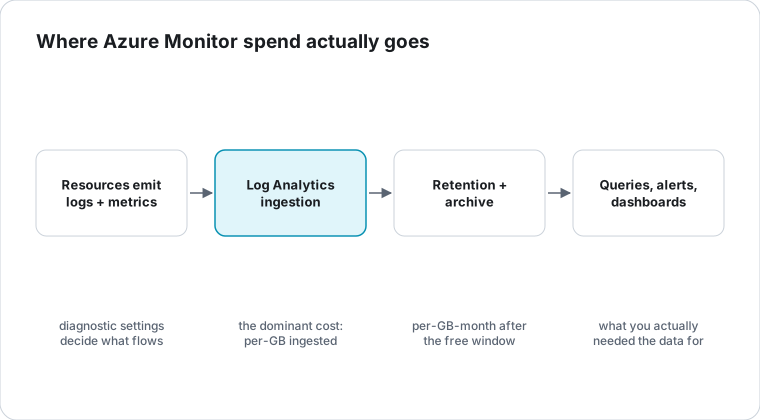
An Azure Monitor bill is mostly a per-gigabyte ingestion meter: Log Analytics and Application Insights charge for every GB your workspaces swallow, and almost nobody budgets for it. Compute and storage get scrutinized constantly; monitoring just grows. Six months in, you discover the ingestion line quietly went from $300 to $1,800 a month. Cutting it without losing observability comes down to five levers, and most teams have not touched any of them.
Which tables should move to Basic or Auxiliary tiers?
The high-volume tables you rarely query interactively. Log Analytics offers per-table billing tiers:
- Analytics (default) — full KQL, full retention. Most expensive.
- Basic — KQL limited to simple lookups (no cross-table aggregations), short retention. Roughly 70% cheaper per GB.
- Auxiliary — bulk dump with no online query, archived for compliance. Cheapest.
The biggest ingestion volume in most workspaces comes from a handful of tables: AzureDiagnostics, AzureMetrics, ContainerLogV2, AppTraces. Check which of these you actually query day to day. ContainerLogV2 probably earns Analytics. AzureDiagnostics is often policy and activity noise you never write a KQL query against — move it to Basic. Compliance archives you must keep but never read live belong in Auxiliary. You change the plan per table under the workspace's Tables blade, and the switch takes effect for new data immediately.
How much retention do you actually need?
Less than you have. Default Log Analytics retention is 31 days included; anything past that costs per GB-month. Most teams set retention to 90 days because someone in compliance said "at least 90" once and nobody re-checked. Audit the actual queries your team ran over the last month. If 95% of them hit data under 14 days old, the interactive retention should be 14 days, and compliance data can sit in cheaper archive-only retention separately, re-hydrated on the rare day someone needs it.
How does adaptive sampling cut Application Insights costs?
By sending a representative subset instead of everything. Application Insights bills per GB ingested, and by default the SDK sends every request, every dependency call, every trace — millions of events a day on a busy app. Adaptive sampling, configured in the SDK, keeps typically 5-25% of events while preserving failure-rate and latency percentiles, because the retained traces are statistically representative. Set the sampling target so each environment stays under about 1 GB a day as a sanity check.
Pair it with telemetry processors that drop pure noise before it ships: health-check pings, expected 404s, and polling endpoints that produce nothing actionable. These alone are often 20-40% of volume.
Set a daily ingestion cap
Because the cap is the difference between an incident and an invoice. For every workspace and every App Insights resource, set a daily ingestion cap in the Usage and estimated costs blade, at roughly 1.5 times normal ingestion. The day a misconfigured app starts hammering the workspace, the cap trips and an alert tells you something broke — instead of the bill telling you next month. A 24-hour log explosion that would have cost $5,000 costs the capped amount. This is the same philosophy as a cost anomaly alert: fail loudly now, not expensively later.
Commitment tiers: when volume earns the discount
Above roughly 100 GB a day of steady ingestion. Commitment tiers start at 100 GB/day and lock in about 30% savings versus pay-as-you-go, with larger tiers at 200, 300, 500 GB/day and beyond. The bet is that you keep that volume or grow into it; the risk is over-committing during a quiet quarter. Tune the other four levers first, then commit to the volume that remains — the same order of operations as rightsizing before buying reservations.
A realistic before-and-after
A mid-size Azure workload spending $1,800 a month on monitoring typically lands here after a tune-up:
- Move AzureDiagnostics (about 40% of volume) to Basic: roughly $450/mo saved.
- Cut interactive retention from 90 to 14 days, with archive-only retention for compliance: roughly $200/mo saved.
- Enable adaptive sampling on App Insights and drop health-check telemetry: roughly $300/mo saved.
- Daily cap as the safety net: $0 saved on the happy path, $1,000+ saved the day something breaks.
That is $950 a month — about 53% — off the monitoring bill, without losing the signal you actually operate on. On estates where monitoring grew unchecked for years, the cut lands closer to the top of the 30-60% range.
Where CloudRift fits
CloudRift's explainer for Log Analytics workspaces and App Insights resources surfaces the exact lever — table plan, retention, sampling, cap — not a generic "review your tier" message. The detail panel says which lever applies to your ingestion mix, and recommendations are ranked by dollar impact with the evidence attached. It is one slice of the broader Azure cost checklist, and the free Waste Check will show you whether monitoring is one of your top leaks.
See which workspaces drive your ingestion bill before tuning anything
Connect read-only, run a free scan, and get a prioritized list of savings with dollars attached.
Tune ingestion first
Monitoring is the quietest line item to overshoot because nobody owns it. Put the noisy tables on cheaper tiers, cut retention to what you query, sample what you ingest, cap every workspace, and only then commit. The signal stays; a third to half of the bill goes.