AI-assisted draft · reviewed, fact-checked, and published by Kevin Proffitt.
MSP Cloud Cost Reports Clients Read: 6-Page Template
An MSP cloud cost report is the document that proves the service pays for itself. The six-page structure clients actually read, and the patterns to drop.
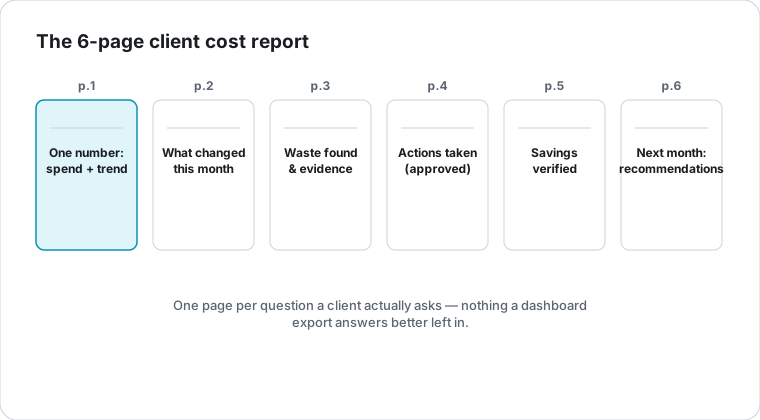
An MSP cloud cost report is the monthly document that proves to a client the managed service is paying for itself. Get it right and the client renews quietly. Get it wrong and you spend the QBR explaining why their bill went up. After looking at hundreds of MSP report templates, the patterns separating the ones clients engage with from the ones that get scrolled past are clear — and most have nothing to do with how detailed the report is.
Stop reporting what is easy to export
Stop leading with volume. The three habits below actively cost MSPs renewals, and all three come from reporting what is easy to export instead of what the client needs to decide. The FinOps Foundation calls the missing discipline allocation and reporting, and Azure Lighthouse gives an MSP the tenant access to do it properly.
1. Stop leading with a 14-page resource inventory
Nobody reads "Resource Group: rg-prod-001 — Storage Account: prodbackupseastus2 — Tier: Standard_GRS — Estimated cost: $42.18/mo" three pages in. CFOs do not want the inventory. They want the trend, the anomalies, and the ask. The inventory belongs in an appendix, where it supports an auditor without burying the story.
2. Stop showing potential savings without confidence
A bullet that says "Could save $1,200/month by rightsizing VMs" with nothing behind it gets discounted to zero. The client has been promised thousands in savings every month for years; the bare number has stopped meaning anything. Show the confidence grade and the supporting signal — CPU average over 30 days, the telemetry source, the transaction count — so the client knows which savings are real. Evidence behind every finding is the standard clients should hold any tool to, a point argued at length on the conflict-of-interest page.
3. Stop hiding what you already did
If you deleted eight orphaned resources and saved the client $1,400 a month, that belongs on page one, not in an appendix. The number that proves your value is the dollars already taken off the bill — not the dollars you might someday save.
What do clients actually read?
1. A one-page executive summary their CFO can read unedited
Total monthly spend, change versus last month, dollars saved this month by you, and the top one or two action items remaining. Four numbers and a sentence. The rest of the document is backup material; most clients only read the cover, and that is fine if the cover carries the story.
2. Anomalies framed by what to do about them
"Spend on App Service jumped 38% this month, driven by a new staging plan provisioned March 14 — confirm with the development team whether that is expected" gets read. "Cost increase: $470" does not. Frame every anomaly with what caused it and what the client needs to decide. The detection mechanics behind catching those spikes early are covered in cloud cost anomaly detection.
3. Carbon and governance alongside cost
For client orgs with sustainability commitments or compliance requirements, a cost number that arrives with a kg CO2 figure and a CIS pass/fail score is materially more valuable. It turns one report into three: FinOps, ESG, and security posture. That is the kind of report a CFO forwards to a board.
4. Realized savings, not potential savings
Track and report the dollars actually taken off the bill through executed actions. CloudRift records these in a Realized Savings Ledger with a verification lifecycle — estimated at scan time, confirmed when a later scan proves the resource is gone, billing-verified when the charges cease in the client's own billing data. "Potential" is marketing language to a CFO; "realized" is accounting language, and it is the one they trust.
What does a report template that works look like?
- Page 1 — Executive summary: spend, change, saved this period, one ask.
- Page 2 — Anomalies with cause and the decision needed.
- Page 3 — Realized savings actions, listed by date, with the recurring savings figure for each.
- Page 4 — Top 5 remaining opportunities, sorted by confidence times dollar value, with risk level.
- Page 5 — Governance posture (CIS or your framework of choice), tagging coverage, identity hygiene.
- Page 6 — Carbon footprint with the month-over-month trend.
- Appendix — Resource inventory and the raw cost-by-type breakdown.
Six pages of substance and the inventory as a reference appendix. Most clients read pages one through three. CFOs read page one. The boring six-page format wins more renewals than the flashy fourteen-page one, because it respects what each reader actually does with the document.
Generating the report from live tenant data
CloudRift's MSP mode generates branded client reports with this structure out of the box — your logo, your colors, realized savings tracked by date, anomalies with explainer text, governance posture from the CIS run, and the carbon ledger month over month. One tenant per client, one dashboard for you across all of them, the operating model described in Azure cost optimization for MSPs. The output is a PDF the client can forward to their CFO without you editing a thing.
Generate this exact report for every client tenant, every month
Connect read-only, run a free scan, and get a prioritized list of savings with dollars attached.
Six pages, kept honest
Report what the client decides with, not what your tooling exports. Lead with realized savings, frame anomalies as decisions, attach confidence to every claim, and move the inventory to the back. The report is the product renewal committees actually see — build it like one.